
[潮汐量化]ETH多空趋势策略
Description du signal
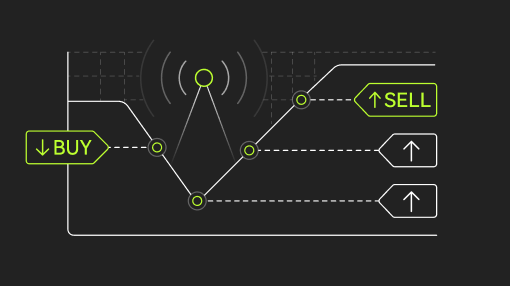
The tidal strategy is a quantitative trading strategy that focuses on capturing market trends, with controllable risks and strong profits, relying on rigorous models and mature logic, and excellent stability.
Core performance (no leverage): annualized rate of return ≥200%, maximum drawdown ≤ 18%, win rate ≥55%, profit factor ≥ 2.0, and the indicator ranks at the high-quality level of the industry.
The profit model is a steady cycle of "small profit-small loss-big profit-small profit", rejecting extreme risks, and achieving compound interest with accurate judgment and position management. The risk resistance is outstanding, and the profitability is still stable in the black swan event on the 10th and 11th, and the verification model is reliable.
Leverage suggestion: Built-in position increase mechanism (win rate exceeds 85%), theoretical 10X, actual 3X, ensure that the available margin ≥ 2 times the order amount, control risk and increase profit.
If you need real data, backtest reports and operation details, you can contact me, and the whole process is transparent and traceable.
The Tidal Strategy is a quantitative trading strategy focusing on capturing market trends, with core advantages of controllable risk and strong profitability, relying on rigorous models and mature logic for excellent stability.
Core Performance (without leverage): Annualized return ≥200%, maximum drawdown ≤18%, win rate ≥55%, profit factor ≥2.0, all indicators at high industry level.
Profit model is a steady cycle of "small profit - small loss - big profit - small profit", rejecting extreme risks, achieving compound growth through accurate judgment and position management. With outstanding risk resistance, it maintained stable profits in the October 11th Black Swan event, verifying model reliability.
Leverage Suggestion: Built-in position increasing mechanism (win rate over 85%), theoretical 10X, actual 3X, ensure available margin ≥ twice the order amount to control risk and improve profit.
For real-trading data, backtest reports and operation details, please contact me, with full transparency and traceability.
Avis de non-responsabilité : le contenu ci-dessus a été traduit automatiquement et est fourni à titre de référence uniquement.
Afficher dans la langue d’origine
Vue d’ensemble
P&L des abonnés (USDT)
-68,03
AUM (USDT)131,83
Taux de gain des abonnés25,00 %
Nombre de déclenchements au cours des 7 derniers jours16
Performances
30 jours
APY backtesté sur 30 jours
--
Paires de trading prises en charge
Perpétuel ETHUSDT
SymboleAPY backtestéMax drawdown sur 7 j

Aucune donnée disponible
Détails du déclencheur de signal
•L’affichage sera retardé de 24 heures
Symbole / HeureType d'entréeMontant par ordreActions
Perpétuel ETHUSDT
03/04/2026 21:00:00
Fermer la position
100,00 %
Sortie longue
Perpétuel ETHUSDT
02/04/2026 22:45:00
Contrats
3
Entrée longue
Perpétuel ETHUSDT
02/04/2026 10:00:00
Fermer la position
100,00 %
Sortie courte
Perpétuel ETHUSDT
02/04/2026 09:30:00
Contrats
3
Entrée courte
Perpétuel ETHUSDT
02/04/2026 05:30:00
Contrats
5
Entrée longue
Perpétuel ETHUSDT
01/04/2026 01:00:00
Fermer la position
100,00 %
Sortie longue
Perpétuel ETHUSDT
01/04/2026 00:45:00
Contrats
2
Entrée longue
Perpétuel ETHUSDT
31/03/2026 23:00:00
Contrats
4
Entrée courte
Perpétuel ETHUSDT
31/03/2026 09:30:00
Contrats
7
Entrée longue
Perpétuel ETHUSDT
30/03/2026 08:45:00
Fermer la position
100,00 %
Sortie longue
Qu’est-ce que le bot de signal ?
Un bot de signaux est une approche de trading exécutée par des données de marché et des indicateurs techniques. Il exécute automatiquement sur la base d’un certain nombre de signaux prédéfinis, notamment des indicateurs techniques, des mouvements de prix, des indices de marché ou une combinaison de tous ces signaux.