
[潮汐量化]ETH多空趋势策略
Opis sygnału
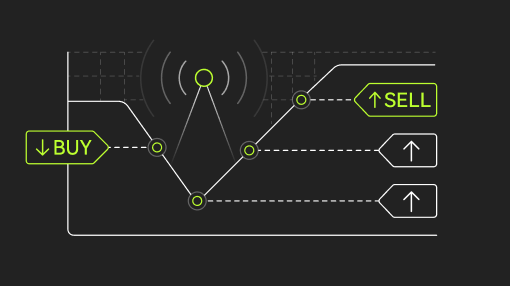
The tidal strategy is a quantitative trading strategy that focuses on capturing market trends, with controllable risks and strong profits, relying on rigorous models and mature logic, and excellent stability.
Core performance (no leverage): annualized rate of return ≥200%, maximum drawdown ≤ 18%, win rate ≥55%, profit factor ≥ 2.0, and the indicator ranks at the high-quality level of the industry.
The profit model is a steady cycle of "small profit-small loss-big profit-small profit", rejecting extreme risks, and achieving compound interest with accurate judgment and position management. The risk resistance is outstanding, and the profitability is still stable in the black swan event on the 10th and 11th, and the verification model is reliable.
Leverage suggestion: Built-in position increase mechanism (win rate exceeds 85%), theoretical 10X, actual 3X, ensure that the available margin ≥ 2 times the order amount, control risk and increase profit.
If you need real data, backtest reports and operation details, you can contact me, and the whole process is transparent and traceable.
The Tidal Strategy is a quantitative trading strategy focusing on capturing market trends, with core advantages of controllable risk and strong profitability, relying on rigorous models and mature logic for excellent stability.
Core Performance (without leverage): Annualized return ≥200%, maximum drawdown ≤18%, win rate ≥55%, profit factor ≥2.0, all indicators at high industry level.
Profit model is a steady cycle of "small profit - small loss - big profit - small profit", rejecting extreme risks, achieving compound growth through accurate judgment and position management. With outstanding risk resistance, it maintained stable profits in the October 11th Black Swan event, verifying model reliability.
Leverage Suggestion: Built-in position increasing mechanism (win rate over 85%), theoretical 10X, actual 3X, ensure available margin ≥ twice the order amount to control risk and improve profit.
For real-trading data, backtest reports and operation details, please contact me, with full transparency and traceability.
Zastrzeżenie: Powyższa treść została przetłumaczona maszynowo i służy wyłącznie celom informacyjnym.
Pokaż w oryginalnym języku
Przegląd
Wskaźnik PnL subskrybenta (USDT)
-68,03
AUM (USDT)131,83
Zyskowne zlecenia25,00%
Ilość wywołań w ciągu ostatnich 7 dni16
Wydajność
30 dni
30-dniowa RRSO przetestowana wstecznie
--
Wspierane pary handlowe
Zamiany wieczyste ETHUSDT
SymbolPrzetestowana wstecznie RRSOMaks. obsunięcie kapitału 7D

Brak dostępnych danych
Szczegóły wywołania sygnału
•Wyświetlacz będzie opóźniony przez 24 godziny
Symbol / godzinaTyp wpisuKwota na zlecenieDziałania
Zamiany wieczyste ETHUSDT
03.04.2026, 21:00:00
Pozycja wyjściowa
100,00%
Wyjście długie
Zamiany wieczyste ETHUSDT
02.04.2026, 22:45:00
Kontrakty
3
Wejście długie
Zamiany wieczyste ETHUSDT
02.04.2026, 10:00:00
Pozycja wyjściowa
100,00%
Wyjście krótkie
Zamiany wieczyste ETHUSDT
02.04.2026, 09:30:00
Kontrakty
3
Wejście krótkie
Zamiany wieczyste ETHUSDT
02.04.2026, 05:30:00
Kontrakty
5
Wejście długie
Zamiany wieczyste ETHUSDT
01.04.2026, 01:00:00
Pozycja wyjściowa
100,00%
Wyjście długie
Zamiany wieczyste ETHUSDT
01.04.2026, 00:45:00
Kontrakty
2
Wejście długie
Zamiany wieczyste ETHUSDT
31.03.2026, 23:00:00
Kontrakty
4
Wejście krótkie
Zamiany wieczyste ETHUSDT
31.03.2026, 09:30:00
Kontrakty
7
Wejście długie
Zamiany wieczyste ETHUSDT
30.03.2026, 08:45:00
Pozycja wyjściowa
100,00%
Wyjście długie
Co to jest bot sygnałowy?
Bot sygnałowy jest podejściem do handlu realizowanym przez dane rynkowe i wskaźniki techniczne. Dokonuje handlu automatycznie na podstawie liczby wstępnie ustawionych sygnałów, w tym wskaźnika technicznego, ruchów cen, wskaźników rynkowych lub kombinacji tych sygnałów.