
[潮汐量化]ETH多空趋势策略
Descrição do sinal
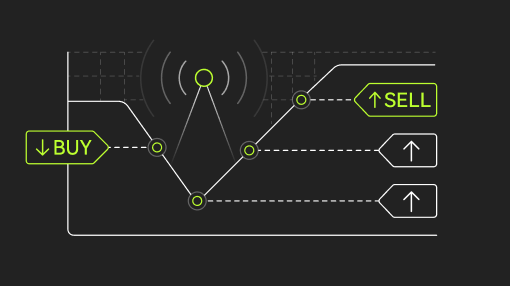
The tidal strategy is a quantitative trading strategy that focuses on capturing market trends, with controllable risks and strong profits, relying on rigorous models and mature logic, and excellent stability.
Core performance (no leverage): annualized rate of return ≥200%, maximum drawdown ≤ 18%, win rate ≥55%, profit factor ≥ 2.0, and the indicator ranks at the high-quality level of the industry.
The profit model is a steady cycle of "small profit-small loss-big profit-small profit", rejecting extreme risks, and achieving compound interest with accurate judgment and position management. The risk resistance is outstanding, and the profitability is still stable in the black swan event on the 10th and 11th, and the verification model is reliable.
Leverage suggestion: Built-in position increase mechanism (win rate exceeds 85%), theoretical 10X, actual 3X, ensure that the available margin ≥ 2 times the order amount, control risk and increase profit.
If you need real data, backtest reports and operation details, you can contact me, and the whole process is transparent and traceable.
The Tidal Strategy is a quantitative trading strategy focusing on capturing market trends, with core advantages of controllable risk and strong profitability, relying on rigorous models and mature logic for excellent stability.
Core Performance (without leverage): Annualized return ≥200%, maximum drawdown ≤18%, win rate ≥55%, profit factor ≥2.0, all indicators at high industry level.
Profit model is a steady cycle of "small profit - small loss - big profit - small profit", rejecting extreme risks, achieving compound growth through accurate judgment and position management. With outstanding risk resistance, it maintained stable profits in the October 11th Black Swan event, verifying model reliability.
Leverage Suggestion: Built-in position increasing mechanism (win rate over 85%), theoretical 10X, actual 3X, ensure available margin ≥ twice the order amount to control risk and improve profit.
For real-trading data, backtest reports and operation details, please contact me, with full transparency and traceability.
Aviso legal: o conteúdo acima foi traduzido automaticamente e destina-se apenas a fins informativos.
Mostrar no idioma original
Visão geral
PnL de subscritores (USDT)
-68,03
AUM (USDT)131,83
Taxa de sucesso de subscritores25,00%
Desencadeamentos nos últimos 7 dias16
Desempenho
30 dias
APY backtested a 30 d
--
Pares de negociação suportados
Perpétuos ETHUSDT
SímboloAPY backtestedRedução máxima 7D

Sem dados disponíveis
Detalhes de desencadeador do sinal
•A apresentação terá um atraso de 24 horas
Símbolo / data e horaTipo de entradaMontante por ordemAções
Perpétuos ETHUSDT
03/04/2026, 21:00:00
Sair de posição
100,00%
Saída longa
Perpétuos ETHUSDT
02/04/2026, 22:45:00
Contratos
3
Entrada longa
Perpétuos ETHUSDT
02/04/2026, 10:00:00
Sair de posição
100,00%
Saída curta
Perpétuos ETHUSDT
02/04/2026, 09:30:00
Contratos
3
Entrada curta
Perpétuos ETHUSDT
02/04/2026, 05:30:00
Contratos
5
Entrada longa
Perpétuos ETHUSDT
01/04/2026, 01:00:00
Sair de posição
100,00%
Saída longa
Perpétuos ETHUSDT
01/04/2026, 00:45:00
Contratos
2
Entrada longa
Perpétuos ETHUSDT
31/03/2026, 23:00:00
Contratos
4
Entrada curta
Perpétuos ETHUSDT
31/03/2026, 09:30:00
Contratos
7
Entrada longa
Perpétuos ETHUSDT
30/03/2026, 08:45:00
Sair de posição
100,00%
Saída longa
O que é o bot de sinais?
Um bot de sinais é uma abordagem ao trading executada por dados do mercado e indicadores técnicos. Efetua transações automáticas com base num número de sinais predefinidos, incluindo indicador técnico, movimentos de preço, índices de mercado, ou uma combinação de todos.