
Top Meme Coins Set For Major Breakout: PENGU, BONK, FLOKI, DOGE

Meme coins like PENGU, BONK, FLOKI, and DOGE are showing critical technical patterns that could spark the next wave of bullish momentum if key breakout levels are breached.
In Brief:
- PENGU/USDT is forming a bull flag after a +170% rally, consolidating above key support with potential to break toward $0.046 if $0.0405 flips.
- BONK/USDT is testing the bottom of a 4H wedge after a 500B token burn, with BBTrend turning positive despite weak MACD, signalling possible recovery if $0.0000283 holds.
- FLOKI/USDT is coiling inside a long-term symmetrical triangle, with a breakout above $0.000145 targeting $0.00025–$0.00030 in Q3–Q4.
- DOGE/USDT is forming a double bottom on the daily chart with a neckline at $0.257; breakout may ignite a rally to $0.434, provided $0.20 support holds.
PENGU/USDT Technical Analysis
PENGU Coin price action remains in a macro bullish structure after an impressive breakout and +170% rally. The current pullback has established a clean bull flag on the daily time frame, which is a common continuation pattern. Price action is consolidating above the key support zone at $0.0318–$0.034.
The RSI is cooling off from overbought territory (currently 63.34), which provides room for another leg up. MACD is also flattening out and a potential bearish cross-over is forming, though not a warning as long as support holds.
Price is still well above the previous wedge breakout and long-term trend support. A break above $0.0405 can be considered further confirmation of the flag breakout targeting the next $0.043–$0.046 zone.
If rejected, price action can drift off back down toward $0.0255, which lines up with previous breakout levels. However, in the face of dips, volume remains low, suggesting bullish consolidation rather than a bull-to-bear distribution.
As long as $0.031 supports, the trend favors buyers with bullsacute hot to take back over if price clears the $0.039 area once again.
BONK/USDT 4H Chart Analysis –
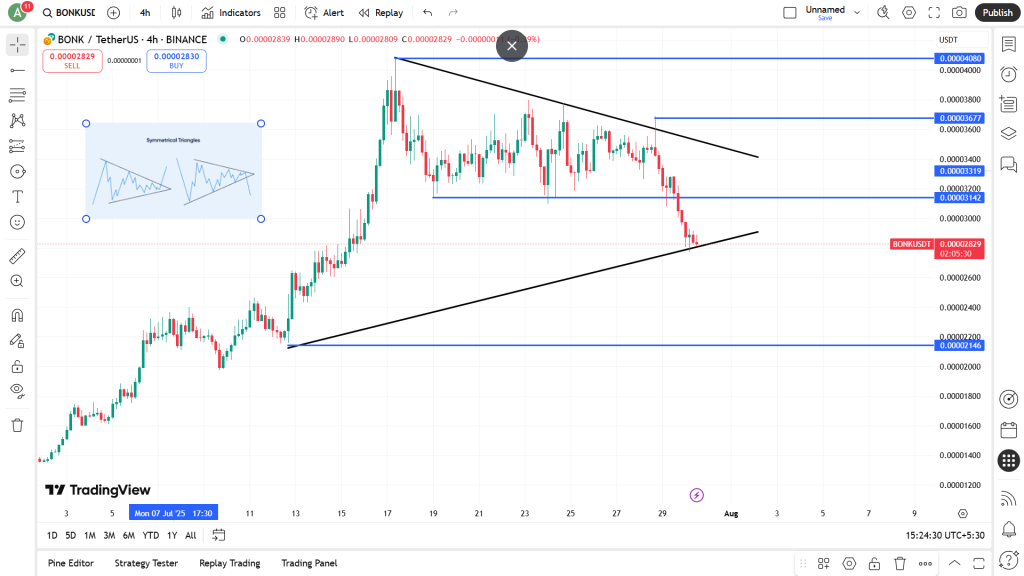
BONK Coin Price is currently trading in proximity to the lower support of a symmetrical wedge (Base 4), indicating a critical some critical short-term considerations for traders.
This comes after recent price action gains earlier in July and has been a stand-alone of volumes 500b token burn on July 24, worth $16.7–$18.6M signalling a similar effort for scarcity and ultimately long-term goals to push price value higher.
Despite favourable tokenomic market conditions relating to the strategy in trying to set up for longer term could very well work with a neutral-to-caution feeling as price explores wedge base territory relative to previous rally fundamentals.
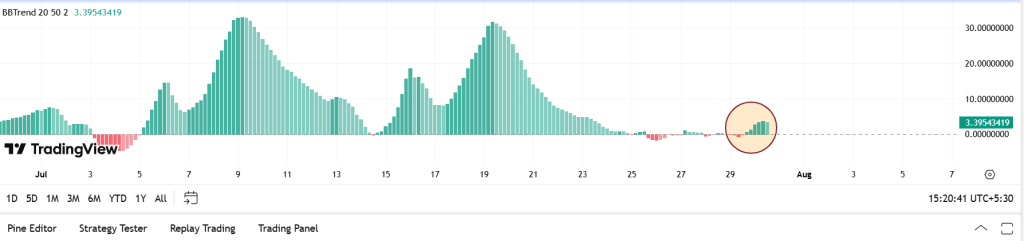
On the bullish side, the BBTrend has flipped positive with rising green bars (+3.39), showing a fresh uptick in momentum—potentially an early sign of accumulation or short-covering.
However, the MACD remains weak, with a deepening bearish crossover and no bullish divergence yet confirmed.
A bounce from the wedge’s lower trendline ($0.0000283) could fuel a move back toward the upper boundary ($0.0000340), with breakout potential targeting $0.000036–$0.000038+.
But if BONK fails to hold this base and closes below $0.0000275, it risks breaking down toward $0.0000250.
Until a breakout is confirmed, traders should remain cautious and watch for volume-backed direction above $0.0000315 or below $0.0000275.
FLOKI/USDT Long-Term Chart Analysis –
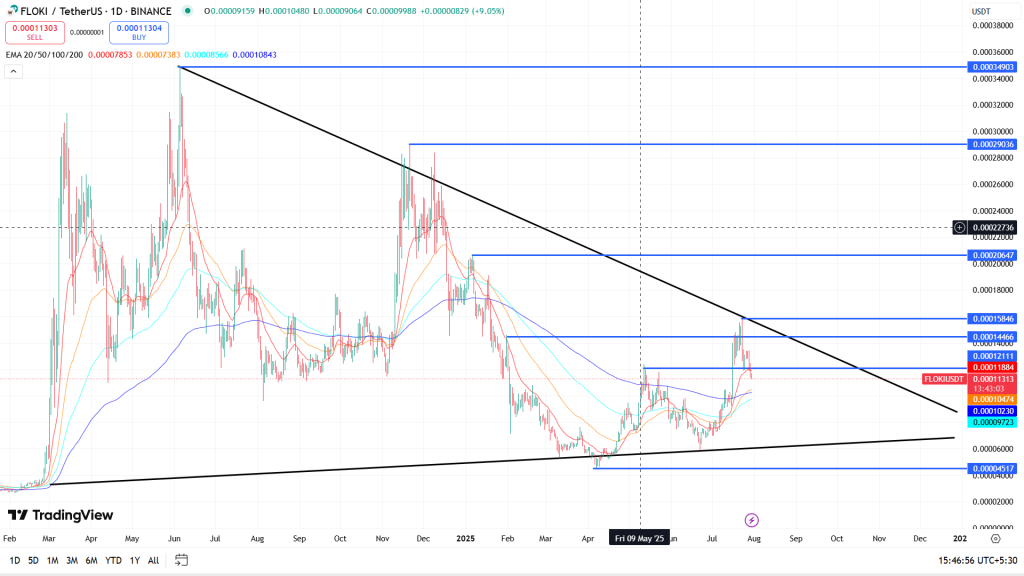
At present, FLOKI Price is undergoing price action within a large symmetrical triangle that has been taking shape since its explosive run-up in early 2024.
This triangle represents long-term price compression between a slow-rising horizontal support trendline and a descending resistance trendline. The price was recently rejected around the upper boundary near $0.00014079 and is now in the process of retracing towards the middle of the triangle.
The continued price compression indicates a coiling of volatility, which is usually then followed by a major breakout event.
To the upside, a breakout to the upside through the descending resistance trendline (~$0.000145–$0.000150) would then send FLOKI higher towards previous highs around ~$0.00025–$0.00030.
Conversely, moving down below the ascending support trendline (currently near $0.000071–$0.000080) would flip the structure into a bear market and invalidate the triangle.
Given its strong community, token utility (e.g., Valhalla, FlokiFi) and its historical price performance after consolidation, FLOKI remains a high conviction watch headed into Q3–Q4. Patience is key as the price continues to tighten within the apex.
DOGE/USDT Price Analysis
Dogecoin (DOGE) price is establishing a textbook double bottom pattern that suggests a possible longer-term reversal. After bouncing off the $0.17-0.18 support twice, DOGE is at the neckline of $0.257.
A clean break through the neckline would likely lead to strong momentum, with targets of $0.288, $0.338 and $0.434 as highlighted on the chart. EMAs (50/100/200) are flattening & tightening, a classic setup before expansion. Volume is coming in on the upward legs, which indicates buying interest.
The pattern stays valid as long as the price stays above $0.20. A clean break of the neckline with volume would turn EMAs into support, likely accelerating momentum through $0.30+.
A failure to break $0.257 cleanly would allow for consolidations to be within the bounds of the move. In conclusion, DOGE is technically set up for upside if bulls reclaim the neckline zone into momentum and test early 2024 highs.