How to Use Value at Risk (VaR) to Manage Your Cryptocurrency Assets


The crypto market is known for its extreme volatility, where the price of cryptocurrencies can vigorously fluctuate within a short period of time. In a market full of uncertainty, managing risks is therefore crucial for any traders, only by analyzing the possible risks of investments can traders determine the extent and occurrence ratio of potential losses in their portfolios.
To evaluate portfolio risk, we can make use of different tools in the market to calculate the “worse-case scenario” in trading, such as Value at Risk (VaR).
Understanding Value at Risk (VaR)
Dubbed the “new science of risk management”, Value at Risk (VaR) is a statistic that measures and quantifies the level of financial risk within a firm, a portfolio or a position over a specific time frame. It can be applied to measure the risk exposure of specific positions or whole portfolios.
A VAR statistic has three components: a time period, a confidence level and a loss amount (or loss percentage). Let’s look at an example of using VaR to calculate risks.
BTC/USDT: VaR Calculation
We will focus on the minute closing price of BTC/USDT between Aug 15–21, 2019 on OKX. This calculation assumes that log-returns are normally distributed.
Step 1: Calculate the minute log-returns
Minute log-returns can be calculated based on the below formula:

Here we use the logarithm of returns instead of price returns. The benefits of using log-returns, versus prices, is log-normality: assuming the prices are distributed log normally, the log return is conveniently normally distributed, which is handy given much of classic statistics presumes normality.
We can then divide the log-returns into 27 intervals: (-14%, -13%), (-12%, -11%), …, (12%, 13%), count the number of minute returns for each interval and we get the following histogram:
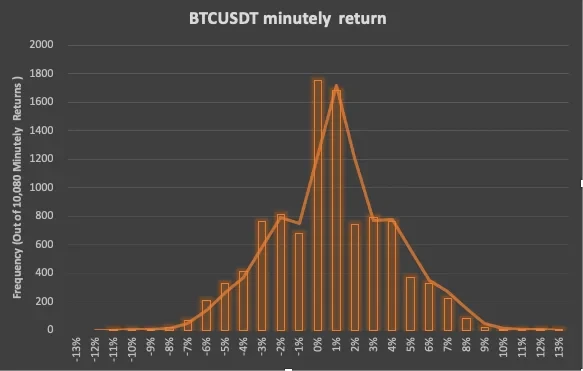
Step 2: Calculate the average and standard deviation of log returns
We can then calculate the average and standard deviation of log-returns based on the formulas:

The average (µ) of 10,080-minute log-returns turns out to be 0.001083%, and the standard deviation (σ) is 0.03170.
Step 3: Calculate VaR based on confidence intervals of normal distribution
Assuming the returns are normally distributed, we can see where do the worst 5% and 1% lie on the normal curve. They show trader’s desired confidence, the standard deviation and the average from the below table:

The Verdict
There are two ways to understand the VaR calculation results:
- With 95% and 99% confidence, we can expect that the worst loss will not exceed 5.23% and 7.38% respectively;
- If we invest $10,000, we are 95% and 99% confident that our worst minute-loss will not exceed $523 (=$10,000 x -5.23%) and $738 (=$10,000 x -7.38%) respectively.
VaR is useful for calculating the maximum expected loss on an investment over a given time and a specified degree of confidence. Traders can apply VaR to determine the level of risk or potential losses of their trading portfolios easily and hence take necessary measures to control the risks.
© 2025 OKX. Se permite la reproducción o distribución de este artículo completo, o pueden usarse extractos de 100 palabras o menos, siempre y cuando no sea para uso comercial. La reproducción o distribución del artículo en su totalidad también debe indicar claramente lo siguiente: "Este artículo es © 2025 OKX y se usa con autorización". Los fragmentos autorizados deben hacer referencia al nombre del artículo e incluir la atribución, por ejemplo, "Nombre del artículo, [nombre del autor, si corresponde], © 2025 OKX". Algunos contenidos pueden ser generados o ayudados por herramientas de inteligencia artificial (IA). No se permiten obras derivadas ni otros usos de este artículo.